本文介绍如何在 Python 语言中开发 Shiny 应用,涉及 shiny 框架、plotly 和 gt 模块。RStudio 团队曾开发了 R 语言中的 Shiny 框架,现在,他们又在 Python 语言中开发了类似功能的框架。Python 语言中缺少制作出版级表格的模块,现在, R 包 gt 的开发者又在 Python 环境中开发了类似功能的模块。在制作统计图形方面,无论是静态图形还是交互图形,Python 语言都不输 R 语言,比如 matplotlib(静态图形)、plotly(交互图形)等。
下面先安装几个本文涉及的模块,截至写作时间,都是较新的版本,本文使用的 Python 版本为 3.9.6。
pip install shiny        # 版本 0.8.1
pip install shinywidgets # 版本 0.3.1
pip install plotly       # 版本 5.20.0
pip install kaleido      # 版本 0.2.1
pip install great_tables # 版本 0.5.0
pip install matplotlib. # 版本 3.8.3| R 语言 | Python 语言 | |
|---|---|---|
| 绘制静态图形 | Base R | matplotlib |
| 绘制交互图形 | plotly | plotly |
| 绘制静态表格 | gt | great_tables |
| 创建交互应用 | shiny | shiny |
相比于 R 语言,Python 语言中的这几个模块丝毫不弱,而且由于社区规模更大、活跃度更高,模块功能会更多。
在制作 Shiny 应用前,复杂而耗时的计算早已完成,我们通常会在数据库中整理好数据集,所以,下面直接使用内置的数据集展示开发一个 Shiny 应用所用的 Python 模块。
1 绘图模块 plotly
导入 plotly 模块并加载该模块内置的数据集 iris(鸢尾花),接着,查看该数据集前几行。
import plotly.express as px
iris = px.data.iris()
iris.head()
## sepal_length sepal_width petal_length petal_width species species_id
## 0 5.1 3.5 1.4 0.2 setosa 1
## 1 4.9 3.0 1.4 0.2 setosa 1
## 2 4.7 3.2 1.3 0.2 setosa 1
## 3 4.6 3.1 1.5 0.2 setosa 1
## 4 5.0 3.6 1.4 0.2 setosa 1调用绘制散点图的函数 scatter,陆续设置横纵坐标变量、颜色映射、图形风格、横纵坐标标题、图形标题、配色的调色板以及与图形布局相关的参数,最终效果如下:
fig = px.scatter(
  iris,
  x="sepal_width",
  y="sepal_length",
  color="species",
  template="simple_white",
  labels={
    "sepal_length": "Sepal Length (cm)",
    "sepal_width": "Sepal Width (cm)",
    "species": "Species of Iris",
  },
  title="Edgar Anderson 的鸢尾花数据",
  color_discrete_sequence=px.colors.qualitative.Set2,
)

# 调整图形布局
fig.update_layout(
  autosize=False,
  # 图形的宽高
  width=700, height=500,
  # 下左上右变空
  margin=dict(b=20, l=30, t=40, r=30),
  # 绘图区域的背景色
  paper_bgcolor="LightSteelBlue",
)
导出标量格式图形,导出的效果图如下:
fig.write_image("img/iris.png")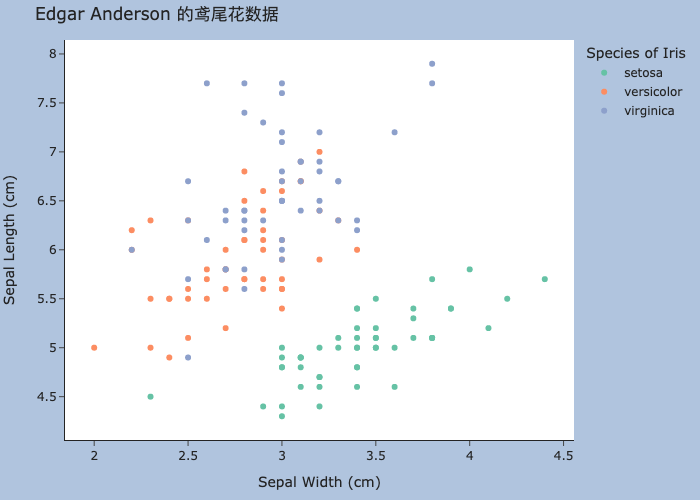
导出矢量格式图形,导出的效果图如下:
import plotly.io as pio
# 设置默认的图片导出格式
pio.kaleido.scope.default_format = "svg"
# 取消加载公式库 MathJax
pio.kaleido.scope.mathjax = None
fig.write_image("img/iris.svg")
如果图形中有数学公式符号,必须加载公式库 MathJax ,此时,会在导出的图形的左下角出现一个框,这是 plotly 的问题。
2 绘图模块 matplotlib
matplotlib 可谓是 Python 语言中最经典的绘图模块,非常成熟,功能也多,有不少模块都是基于它。下面还是基于鸢尾花数据集,绘制风格类似前面 plotly 的分组散点图。
import matplotlib.pyplot as plt
# matplotlib 字体管理器
import matplotlib.font_manager as fm
import numpy as np # np.arange
# 设置字体属性
fontP = fm.FontProperties()
# 查看可用的字体 fm.get_font_names()
# 设置字体
fontP.set_family('Noto Sans CJK SC')
# 设置字号
fontP.set_size(14)
# 鸢尾花类别
species = ["setosa", "versicolor", "virginica"]
# 从调色板 Set2 中提取 3 个颜色值
colors = plt.colormaps['Set2'](np.arange(3))
# 设置绘图区域
plt.figure(figsize=[7,5], facecolor='lightsteelblue', layout="constrained")
# 设置绘图风格 plt.style.available
with plt.style.context("fast"):
    for i in range(len(species)):
        plt.scatter(
            x="sepal_width",
            y="sepal_length",
            color=colors[i],
            label=species[i],
            data=iris[iris["species"] == species[i]],
        )
    plt.xlabel("Sepal Width (cm)") # 横坐标标题
    plt.ylabel("Sepal Width (cm)") # 纵坐标标题
    plt.title("Edgar Anderson 的鸢尾花数据", loc="left", fontproperties=fontP)
    plt.legend(
        framealpha=0,  # 图例背景透明
        bbox_to_anchor=(1.05, 1),
        loc="upper left",
        borderaxespad=0.0,
        title="Species of Iris", # 图例标题
    )
plt.show()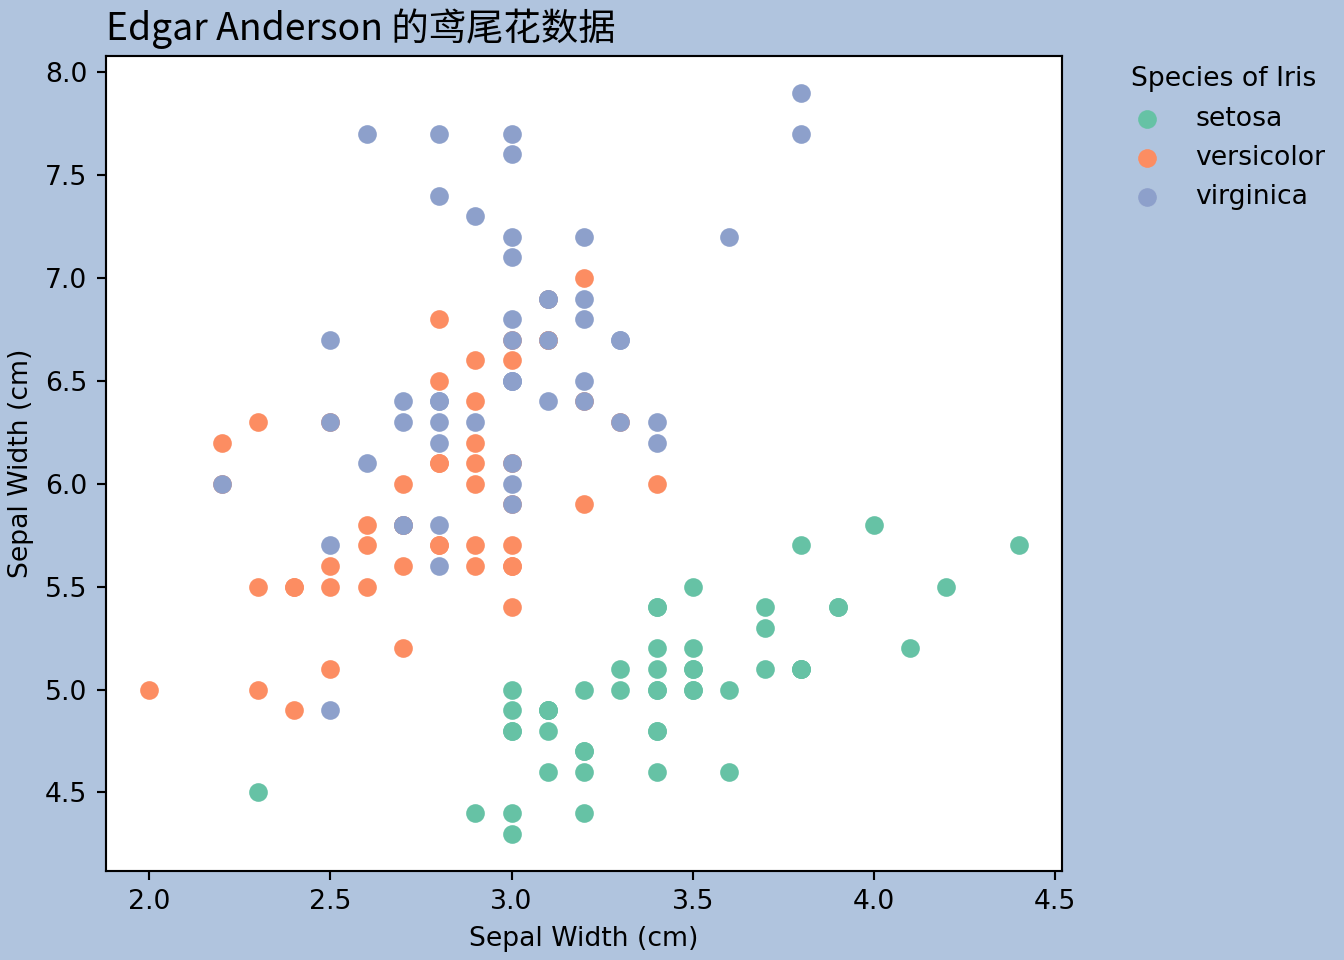
图 2.1: matplotlib 绘制分组散点图
无论是 R 语言还是 Python 语言,使用基础的绘图系统绘制分组散点图都不太容易。考虑到图例制作不太方便,先按鸢尾花种类分组,采用循环的方式,一组一组地绘制散点图。此外,横纵坐标轴标题,图例位置和标题,字体和颜色,全局绘图主题等内容的设置非常多。尽管如此,一旦熟悉 R 语言 Base R 的绘图系统,配置这些只需对照着功能翻 matplotlib 的帮助手册。
3 制表模块 itables
类似 R 包 DT,itables 模块也是基于 DataTables 库。
from itables import init_notebook_mode, show

init_notebook_mode(all_interactive=True)
show(iris, lengthMenu=[5, 10, 30])
以上代码需要运行在 Jupyter 环境中,在 Quarto 文档中要使用 Jupyter 引擎。
4 制表模块 great_tables
先导入 great_tables 模块的 GT 函数和 html 函数,前者实现表格操作的核心功能,后者借助 HTML 格式对局部细节进行调整。制作出来的表格风格简洁,很清爽。
from great_tables import GT, html

gt_iris = (
  GT(iris.head())
  .tab_header(title="Edgar Anderson 的鸢尾花数据(部分)")
  .tab_source_note(source_note="数据来源:R 软件内置数据集")
  .tab_spanner(label="花萼", columns=["sepal_length", "sepal_width"])
  .tab_spanner(label="花瓣", columns=["petal_length", "petal_width"])
  .cols_move_to_start(columns=["species"])
  .cols_label(
    sepal_length=html("长度"),
    sepal_width=html("宽度"),
    petal_length=html("长度"),
    petal_width=html("宽度"),
    species=html("<b>种类</b>"),
  )
  .data_color(
    columns="sepal_length",
    palette="Oranges",
    na_color="white"
  )
  .cols_hide(columns="species_id")
)
gt_iris| Edgar Anderson 的鸢尾花数据(部分) | ||||
|---|---|---|---|---|
| 种类 | 花萼 | 花瓣 | ||
| 长度 | 宽度 | 长度 | 宽度 | |
| setosa | 5.1 | 3.5 | 1.4 | 0.2 |
| setosa | 4.9 | 3.0 | 1.4 | 0.2 |
| setosa | 4.7 | 3.2 | 1.3 | 0.2 |
| setosa | 4.6 | 3.1 | 1.5 | 0.2 |
| setosa | 5.0 | 3.6 | 1.4 | 0.2 |
| 数据来源:R 软件内置数据集 | ||||
顺便一提,plotly 模块支持制作表格,只是内置的制表功能一方面比较弱(无法交互),另一方面使用不太方便(相比于 R 包 DT 或 gt)。
import plotly.graph_objects as go

iris_head = iris.head().drop("species_id", axis = 1)
iris_table = go.Figure(
    data=[
        go.Table(
            header=dict(
                values=list(iris_head.columns),
                fill_color="paleturquoise",
                align="left"
            ),
            cells=dict(
                values=[
                    iris_head.sepal_length,
                    iris_head.sepal_width,
                    iris_head.petal_length,
                    iris_head.petal_width,
                    iris_head.species
                ],
                fill_color="lavender",
                align="left",
            ),
        )
    ]
)
iris_table.show()
5 网页应用 shiny
Python 语言中陆续出现很多流行的网页开发框架,其中,shiny 框架是最近两年 RStudio 出品的。该框架汲取了原 R 语言社区的 shiny 框架经验,以及参考了 Python 社区现有网页开发框架的特点。因此,新框架往往有一些后发优势。
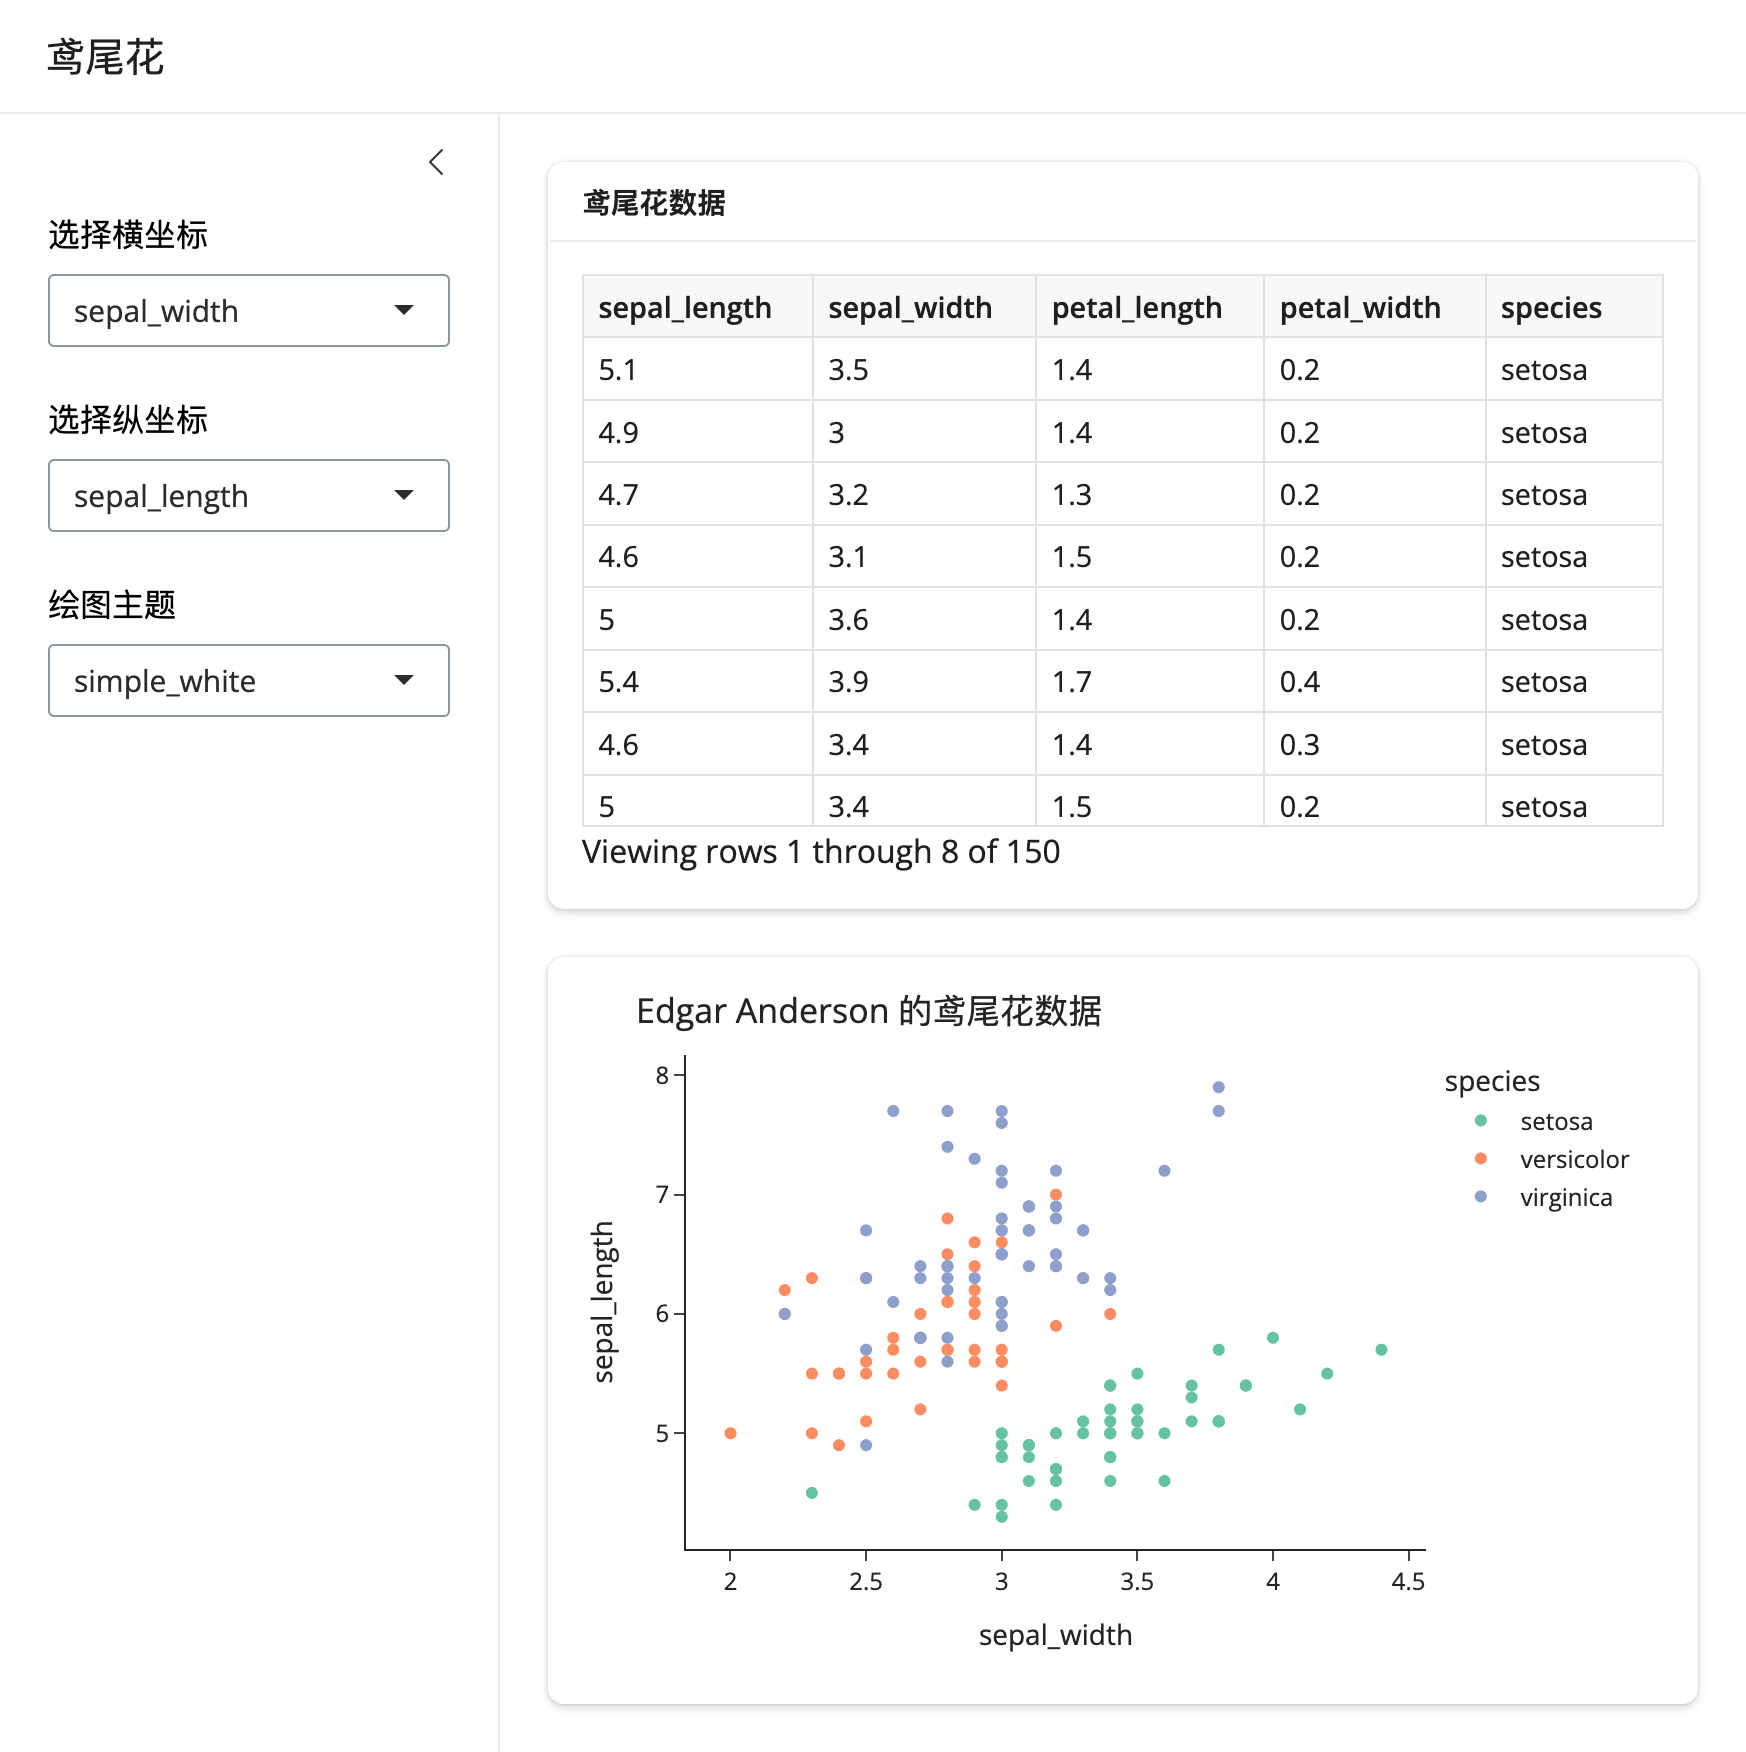
相比于 Shiny for R,最直接的感受是看起来更加清爽。以上 Shiny 应用的代码见链接。图中表格渲染采用 shiny 内置的函数,自带行过滤和列排序,相比于 R 版功能更加强大,此外,通过Jupyter Widgets支持第三方的专门制表模块ipydatagrid。图形制作采用 plotly 包,因其功能强大而成熟。
在熟悉 R 语言中的 shiny 包之后,会发现很多函数是类似的。不仅如此,页面布局、输入组件、输出控制等部分的使用逻辑都是一样的。所以,只需要从示例、模版出发,改动内容,非常方便。