注:本文的绘图代码借助 AI 转化和生成。读取数据的代码由 R 语言版转为 Python 版,绘图代码由 AI 生成,再手动调整。
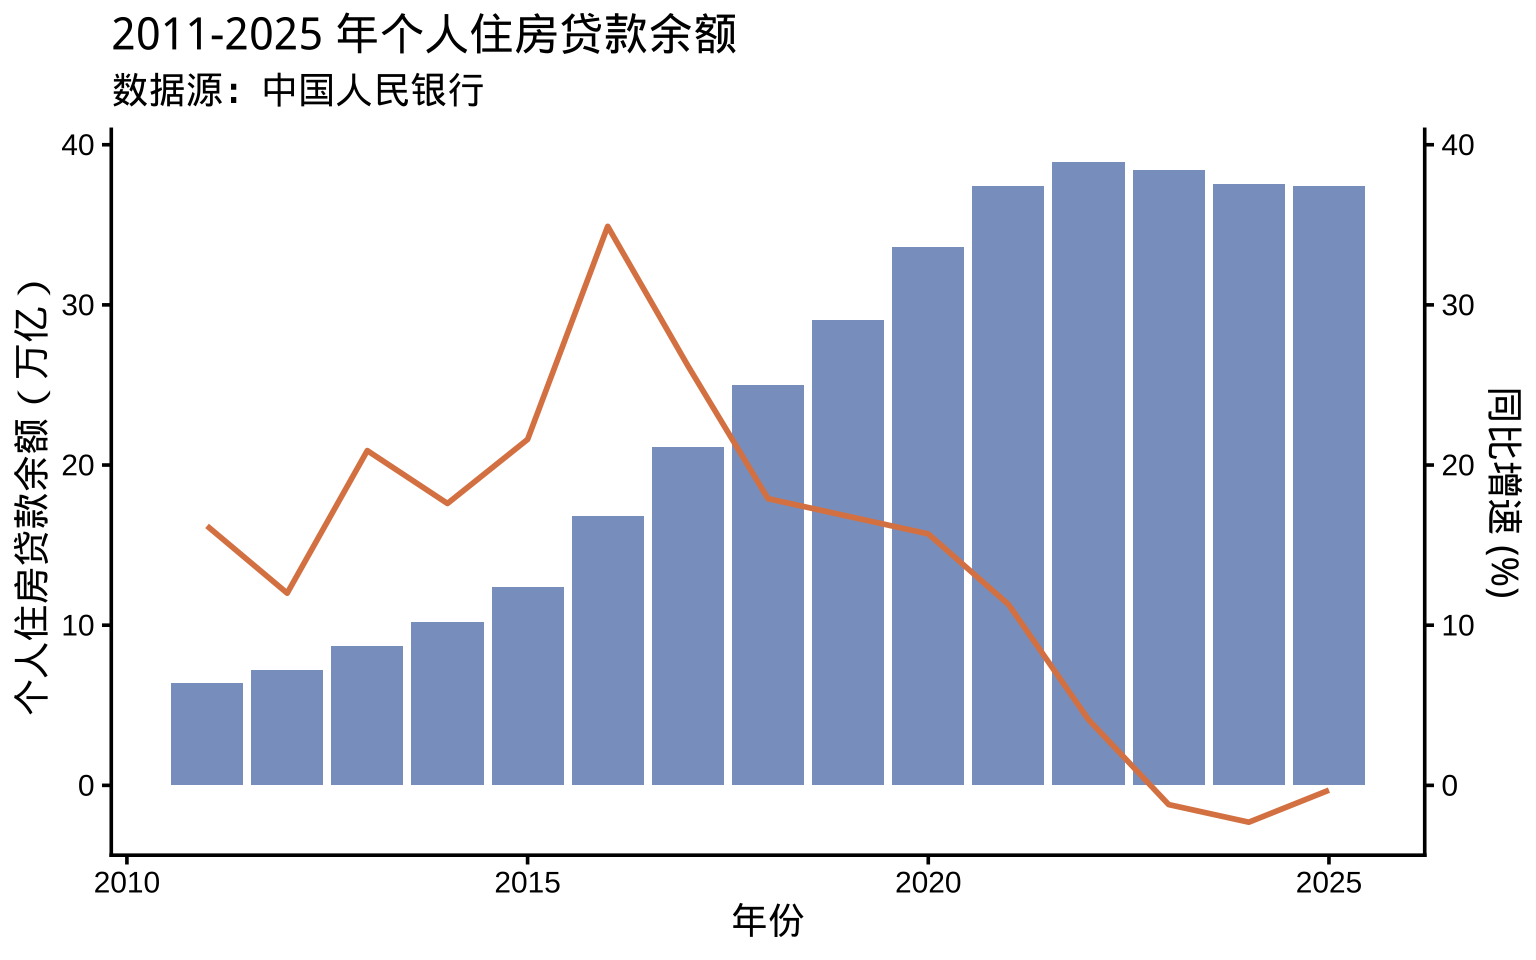
个人住房贷款余额的变化能反应房地产市场居民端购房情况。结合数据来看,购房需求见顶,房地产市场进入存量时代。从 2011 年到 2025 年,个人住房贷款余额从 6.4 万亿增加到 37.44 万亿,信贷扩展了近 5 倍。而中国 GDP 从 47 万亿到 140 万亿,增加了仅 2 倍。
import pandas as pd
from io import StringIO

# R 中的文本数据
text_data = """年份	季度	个人住房	同比增速
2011	Q3	6.4	16.2
2012	Q3	7.2	12.0
2013	Q3	8.7	20.9
2014	Q3	10.2	17.6
2015	Q3	12.4	21.6
2016	Q3	16.8	34.9
2017	Q3	21.1	26.2
2018	Q3	24.97	17.9
2019	Q3	29.05	16.8
2020	Q3	33.59	15.7
2021	Q3	37.4	11.3
2022	Q3	38.9	4.1
2023	Q3	38.4	-1.2
2024	Q3	37.56	-2.3
2025	Q3	37.44	-0.3"""

# 读取到 DataFrame(类似 R 的 read.table)
house_loan = pd.read_table(StringIO(text_data), sep='\t', header=0)
print(house_loan)
## 年份 季度 个人住房 同比增速
## 0 2011 Q3 6.40 16.2
## 1 2012 Q3 7.20 12.0
## 2 2013 Q3 8.70 20.9
## 3 2014 Q3 10.20 17.6
## 4 2015 Q3 12.40 21.6
## 5 2016 Q3 16.80 34.9
## 6 2017 Q3 21.10 26.2
## 7 2018 Q3 24.97 17.9
## 8 2019 Q3 29.05 16.8
## 9 2020 Q3 33.59 15.7
## 10 2021 Q3 37.40 11.3
## 11 2022 Q3 38.90 4.1
## 12 2023 Q3 38.40 -1.2
## 13 2024 Q3 37.56 -2.3
## 14 2025 Q3 37.44 -0.3import matplotlib.pyplot as plt
# 设置中文字体
import matplotlib.font_manager as fm
fontP = fm.FontProperties()
fontP.set_family('Noto Serif CJK SC')
fontP.set_size(14)
# 创建双轴图
fig, ax1 = plt.subplots(figsize=(8, 5))
# 左轴:个人住房(柱状图)
ax1.bar(house_loan['年份'], house_loan['个人住房'], color='#4C72B0', label='个人住房')
ax1.set_xlabel('年份', fontproperties=fontP)
ax1.set_ylabel('个人住房贷款余额(单位:万亿)', fontproperties=fontP)
# 右轴:同比增速(线图)
ax2 = ax1.twinx()
ax2.plot(house_loan['年份'], house_loan['同比增速'], color='#DD8452', marker='o', label='同比增速')
ax2.set_ylabel('同比增速 (%)', fontproperties=fontP)
# 添加标题和图例
plt.title('2011-2025年个人住房贷款余额', fontproperties=fontP)
fig.legend(loc='upper left', bbox_to_anchor=(0.12, 0.88), prop=fontP)
# 背景网格线
plt.grid(linestyle="--")
plt.show()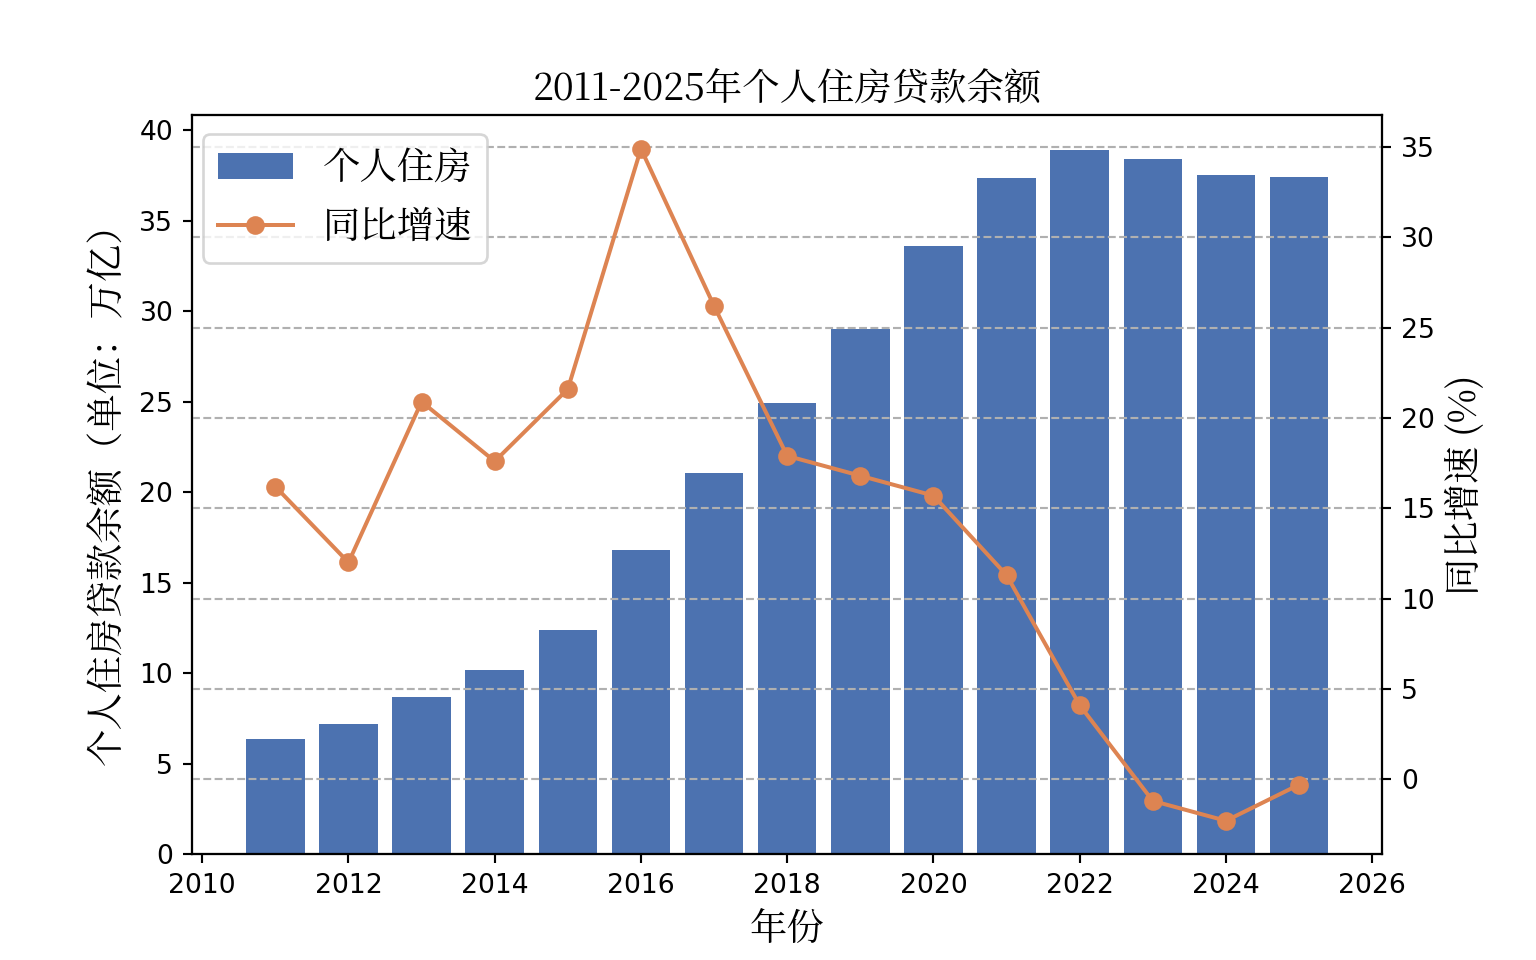
数据来源:
- 中华人民共和国中央人民政府,比如2025年三季度金融机构贷款投向统计报告 近期数据
- 中国人民银行,比如2025年货币政策执行报告 历史数据
2022 年个人住房贷款余额达到顶峰,之后略微降低。说明个人住房需求都得到满足,而不再买房吗?不是的,实际上,许多居民想买而买不起城里的房子。说明居民不再继续贷款购房了吗?是的,一部分未能在城里安家的居民更愿意拿钱在老家购房,特别是钱在城里购房不足而在老家建房有余的人。另一部分,持币观望的人,这分两类,还未购房的人,已有住房想改善的人。
说明居民还款量多于贷款量。当前房地产市场,不再有大量新的购房者。过去已经背上房贷的人在还款,新增的个人住房贷款在减少,还款减去贷款是正数。
附:
R 语言读取数据的代码。
house_loan = read.table(text =
"年份	季度	个人住房	同比增速
2011	Q3	6.4	16.2
2012	Q3	7.2	12.0
2013	Q3	8.7	20.9
2014	Q3	10.2	17.6
2015	Q3	12.4	21.6
2016	Q3	16.8	34.9
2017	Q3	21.1	26.2
2018	Q3	24.97	17.9
2019	Q3	29.05	16.8
2020	Q3	33.59	15.7
2021	Q3	37.4	11.3
2022	Q3	38.9	4.1
2023	Q3	38.4	-1.2
2024	Q3	37.56	-2.3
2025	Q3	37.44	-0.3
", header = T, sep = "\t")
以上数据是我手动从 PDF 报告和 HTML 网页中复制粘贴到 Excel 表格,再从表格复制粘贴到本文档的。
library(gglite)
g2(house_loan, x = "年份", y = "个人住房") |>
  mark_interval() |>
  axis_y(title = "个人住房贷款余额(万亿)") |>
  title_(text = "2011-2025 年个人住房贷款余额",
         subtitle = '数据源:中国人民银行') |>
  theme_academy()
g2(house_loan, x = "年份", y = "同比增速", color = '#DD8452') |>
mark_line() |>
style_mark(lineWidth = 2) |>
axis_y(position = "right", title = "同比增速(单位:%)") |>
theme_academy()如何合二为一呢?scale_y() 函数中设置 independent = TRUE 。
library(gglite)
# 双轴图:柱状图(个人住房,左轴)+ 线图(同比增速,右轴)
g2(house_loan, x = '年份') |>
  mark_interval(encode = list(color = '#4C72B0', y = '个人住房')) |>  # 柱状图
  axis_y(position = 'left', title = "个人住房贷款余额(万亿)") |>
  scale_y(independent = TRUE) |> # 独立 y 轴
  mark_line(encode = list(color = '#DD8452', y = '同比增速')) |>  # 线图
  style_mark(lineWidth = 2) |>
  axis_y(position = 'right', title = '同比增速 (%)') |>  # 右轴标题
  title_(text = "2011-2025 年个人住房贷款余额",
         subtitle = '数据源:中国人民银行') |>
  theme_academy()
最后,补充 ggplot2 包绘制双轴图的代码。
library(ggplot2)##
## Attaching package: 'ggplot2'## The following objects are masked from 'package:gglite':
##
## coord_polar, coord_radial, scale_shape, scale_size, theme_classic,
## theme_dark, theme_lightshowtext::showtext_auto()
# 双轴图:左轴柱状图(个人住房),右轴线图(同比增速)
ggplot(house_loan, aes(x = 年份)) +
geom_bar(aes(y = 个人住房), stat = "identity", fill = "#4C72B0", alpha = 0.7) +
geom_line(aes(y = 同比增速), color = "#DD8452", linewidth = 1) +
scale_y_continuous(
name = "个人住房贷款余额(万亿)",
sec.axis = sec_axis(~ ., name = "同比增速 (%)") # 右轴
) +
labs(title = "2011-2025 年个人住房贷款余额", subtitle = "数据源:中国人民银行") +
theme_classic(base_size = 14)