复现 ISLR (《Introduction to Statistical Learning with Applications in R》) 书中图 2.3 — 收入关于受教育年限、工作资历的关系。
library(readr)
# https://github.com/rghan/ISLR/blob/master/Income2.csv
Income <- read_csv("data/Income2.csv", col_types = cols(x1 = col_skip()))
拟合数据 Local Polynomial Regression Fitting
model <- loess(Income ~ Education + Seniority, data = Income)生成预测值
x_Education <- seq(min(Income$Education), max(Income$Education), length = 30)
x_Seniority <- seq(min(Income$Seniority), max(Income$Seniority), length = 30)

pred_function <- function(x1, x2) {
  predict(model, newdata = cbind(x1, x2))
}

y_Income <- outer(x_Education, x_Seniority, pred_function)
三维透视图可视化局部多项式回归的结果
op <- par(mar = rep(0, 4))
point_pmat <- persp(
  x = x_Education, y = x_Seniority, z = y_Income,
  theta = 25, # 绕 z 轴旋转
  phi = 30,  # 绕 x 轴旋转
  expand = 1,
  col = "dodgerblue3", r = 10,
  xlab = "Years of Education", ylab = "Seniority", zlab = "Income"
)

points(trans3d(
  x = Income$Education, y = Income$Seniority,
  z = Income$Income, pmat = point_pmat
), col = "red", pch = 16)

for (i in 1:dim(Income)[1]) {
  z <- seq(Income$Income[i], pred_function(Income$Education[i], Income$Seniority[i]), length = 10)
  lines(trans3d(x = Income$Education[i], y = Income$Seniority[i], z = z, pmat = point_pmat))
}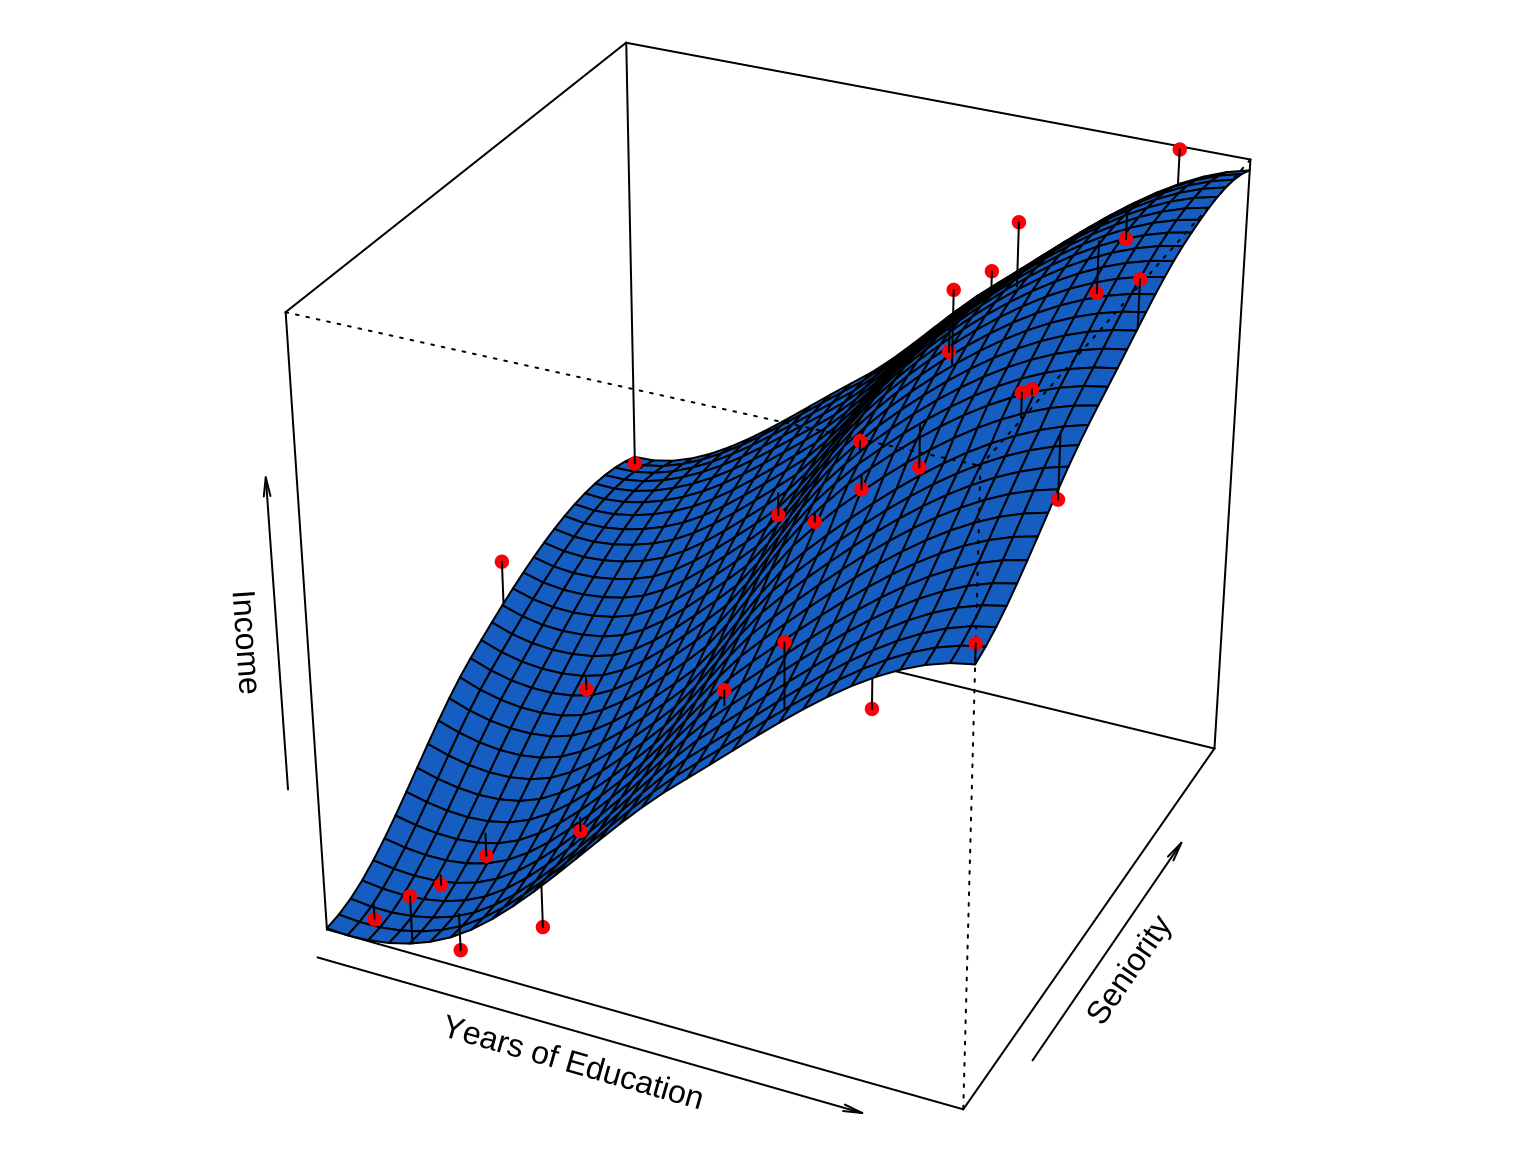
图 1: 局部多项式回归结果的三维可视化
on.exit(par(op))